Understanding Tableau Order of Operations | Data Visualization Guide
Tableau is one of the most popular business intelligence tools today. It commands a market share of 14.08% in this niche, second only to Microsoft Power BI, which has a market share of 15.74%.

As popular as it is, to get the most out of this program, you must understand Tableau’s order of operations, a.k.a. its query pipeline.
This blog will cover the basics of these operations, walk you through the right order of applying them, and discuss their impacts to help you achieve optimal results.
Why Does Understanding Tableau’s Order of Operations Matter?

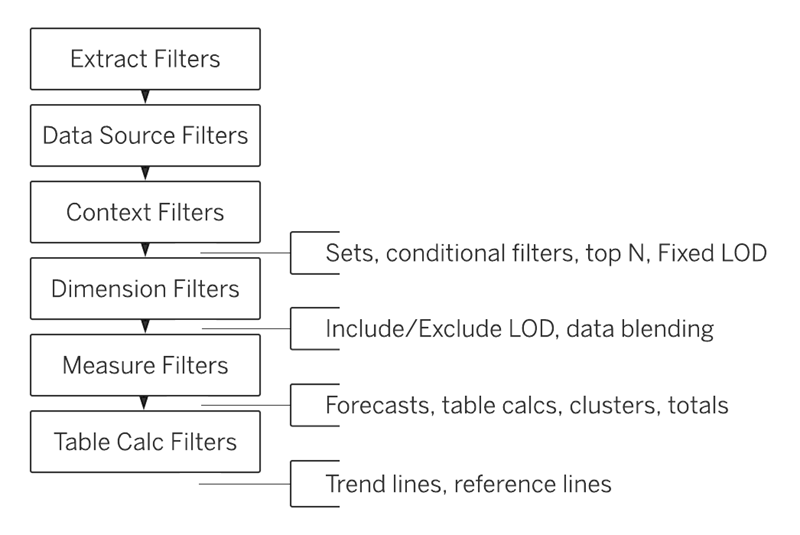
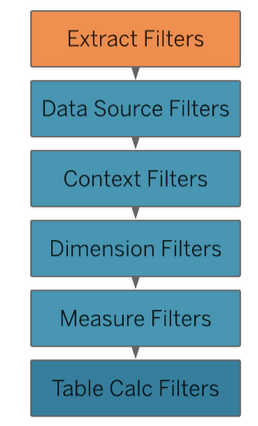
Tableau executes operations specifically dictated by the “order of operations,” as shown in the image above.
The concept here is similar to the BODMAS (Bracket, Order, Division, Multiplication, Addition, and Subtraction) rule in mathematics, wherein not following this order can skew your results.
Tableau’s order of operations ensures that every step in your data process interacts as expected with others. Understanding each step and where it fits into the hierarchy will ensure you have the expected visualizations.
With that said, let’s look at how Tableau executes its query pipeline.
A Breakdown Of Tableau’s Order Of Operations
In Tableau’s query pipeline, filters and calculations are processed strictly from top to bottom.
This section will break down each component, explain its purpose, and show how it impacts the final visualization.

1. Extract Filters
Extract filters act as gatekeepers by limiting the data pulled into Tableau before it reaches your worksheet. This filter is useful when you want to reduce your dataset size for better performance or focus only on relevant data categories.
Since extract filters are applied first, any data filtered out here won’t be available in later stages of analysis or for subsequent filters. It’s essentially as if the data never existed in the workbook, which can speed up processing and simplify the dataset.
Pro Tip: Use extract filters to limit large datasets at the source, making your Tableau workbook more efficient and manageable.
2. Data Source Filters
Data source filters apply to the whole data source within your workbook, filtering out data before it becomes available to individual worksheets. They work similarly to extract filters but are accessible whether your data is live or extracted.
Data source filters reduce data across all worksheets. This is helpful when you want to enforce a consistent filter across multiple views in your workbook, ensuring uniformity and preventing individual sheets from reloading unnecessary data.
Pro Tip: Data source filters are helpful in team environments where multiple users access a workbook and help maintain consistency across shared views.
3. Context Filters
Context filters set the stage for other filters. When you add a context filter, it becomes the “primary” filter that determines the subset of data on which other filters will operate. Context filters help you create dependent filters.
For instance, if you first apply a context filter for “Region,” any subsequent filters, such as a “Product” filter, will only impact data within the selected region. This dependency ensures that Tableau processes relevant data first, improving clarity and often boosting performance.
Pro Tip: Use context filters to create a dynamic hierarchy among filters.
For example, add a high-level context filter like “Year” to focus only on recent data before applying additional, more detailed filters. This can enhance your analysis speed and allow more focused exploration.
4. Top N and Conditional Filters
Top N and conditional filters allow you to filter data based on specific conditions, such as the top 10 products by sales or customers by profit.
These filters sit above Dimension filters in the hierarchy, meaning they can limit data before further refinement through Dimension filters. Without understanding this sequence, you may inadvertently exclude data, affecting the intended outcome.
Pro Tip: Be mindful of where you place Top N filters, especially when combined with other filters. If you want the top results within a specific category (e.g., the top 5 products in the “Technology” category), apply a context filter to the category first to ensure accurate filtering.
5. Dimension Filters
Dimension filters are standard filters applied directly to your dimension fields. They refine data based on discrete categorical fields, like filtering by product name, region, or customer.
Since Dimension filters are processed after context filters and conditional filters, they offer finer data control but are dependent on the filters applied above them. This layered impact can influence what data you see and what calculations Tableau processes in subsequent steps.
Pro Tip: Use Dimension filters to add specificity to your views after broader filters have already narrowed the dataset. This approach allows you to build focused analyses with reduced computational load.
6. Measure Filters
Measure filters and refine data based on numerical parameters, like filtering sales over $10,000. These are useful when you need quantitative thresholds within your dataset.
Measure filters come after Dimension filters, allowing you to focus only on specific ranges or values within the context already established by higher filters. This enables detailed analysis of quantitative data within previously defined categories or regions.
Pro Tip: Measure filters are excellent for setting benchmarks or thresholds, such as limiting data to profitable products or revenue over a certain amount, giving more focus to performance-based analysis.
7. Table Calculation Filters
Table calculation filters filter data based on calculations performed at the table level, like percentages, running totals, or moving averages. They are among the last filters processed, so they only apply to calculated fields within the view.
Impact on Results: Since table calculation filters are applied after almost all other filters, they do not influence data earlier in the pipeline. This unique positioning allows you to filter based on dynamically calculated results, such as keeping only top-performing categories based on a cumulative percentage.
Pro Tip: Use table calculation filters for visualizations requiring more advanced calculations or summaries, showing only items contributing to 80% of total sales. They can simplify complex analyses, but remember they only affect the visualized data.
Wrapping It Up
Tableau’s order of operations is an essential concept that helps you manage and control data at each step in your analysis journey.
Understanding the sequence and influence of each filter will help you refine your data view, ensure accuracy, and ultimately create efficient and effective dashboards.
Whether you are new to Tableau or an experienced user, knowing when and where to apply each filter will be key to attaining accurate results.
About MassMailer
MassMailer is a powerful email solution that integrates natively with Salesforce, allowing seamless bulk email capabilities without restrictions. Designed with efficiency in mind, it features tools and features that facilitate easy email creation, detailed tracking, and maintaining sender reputation.
