


Table of Contents
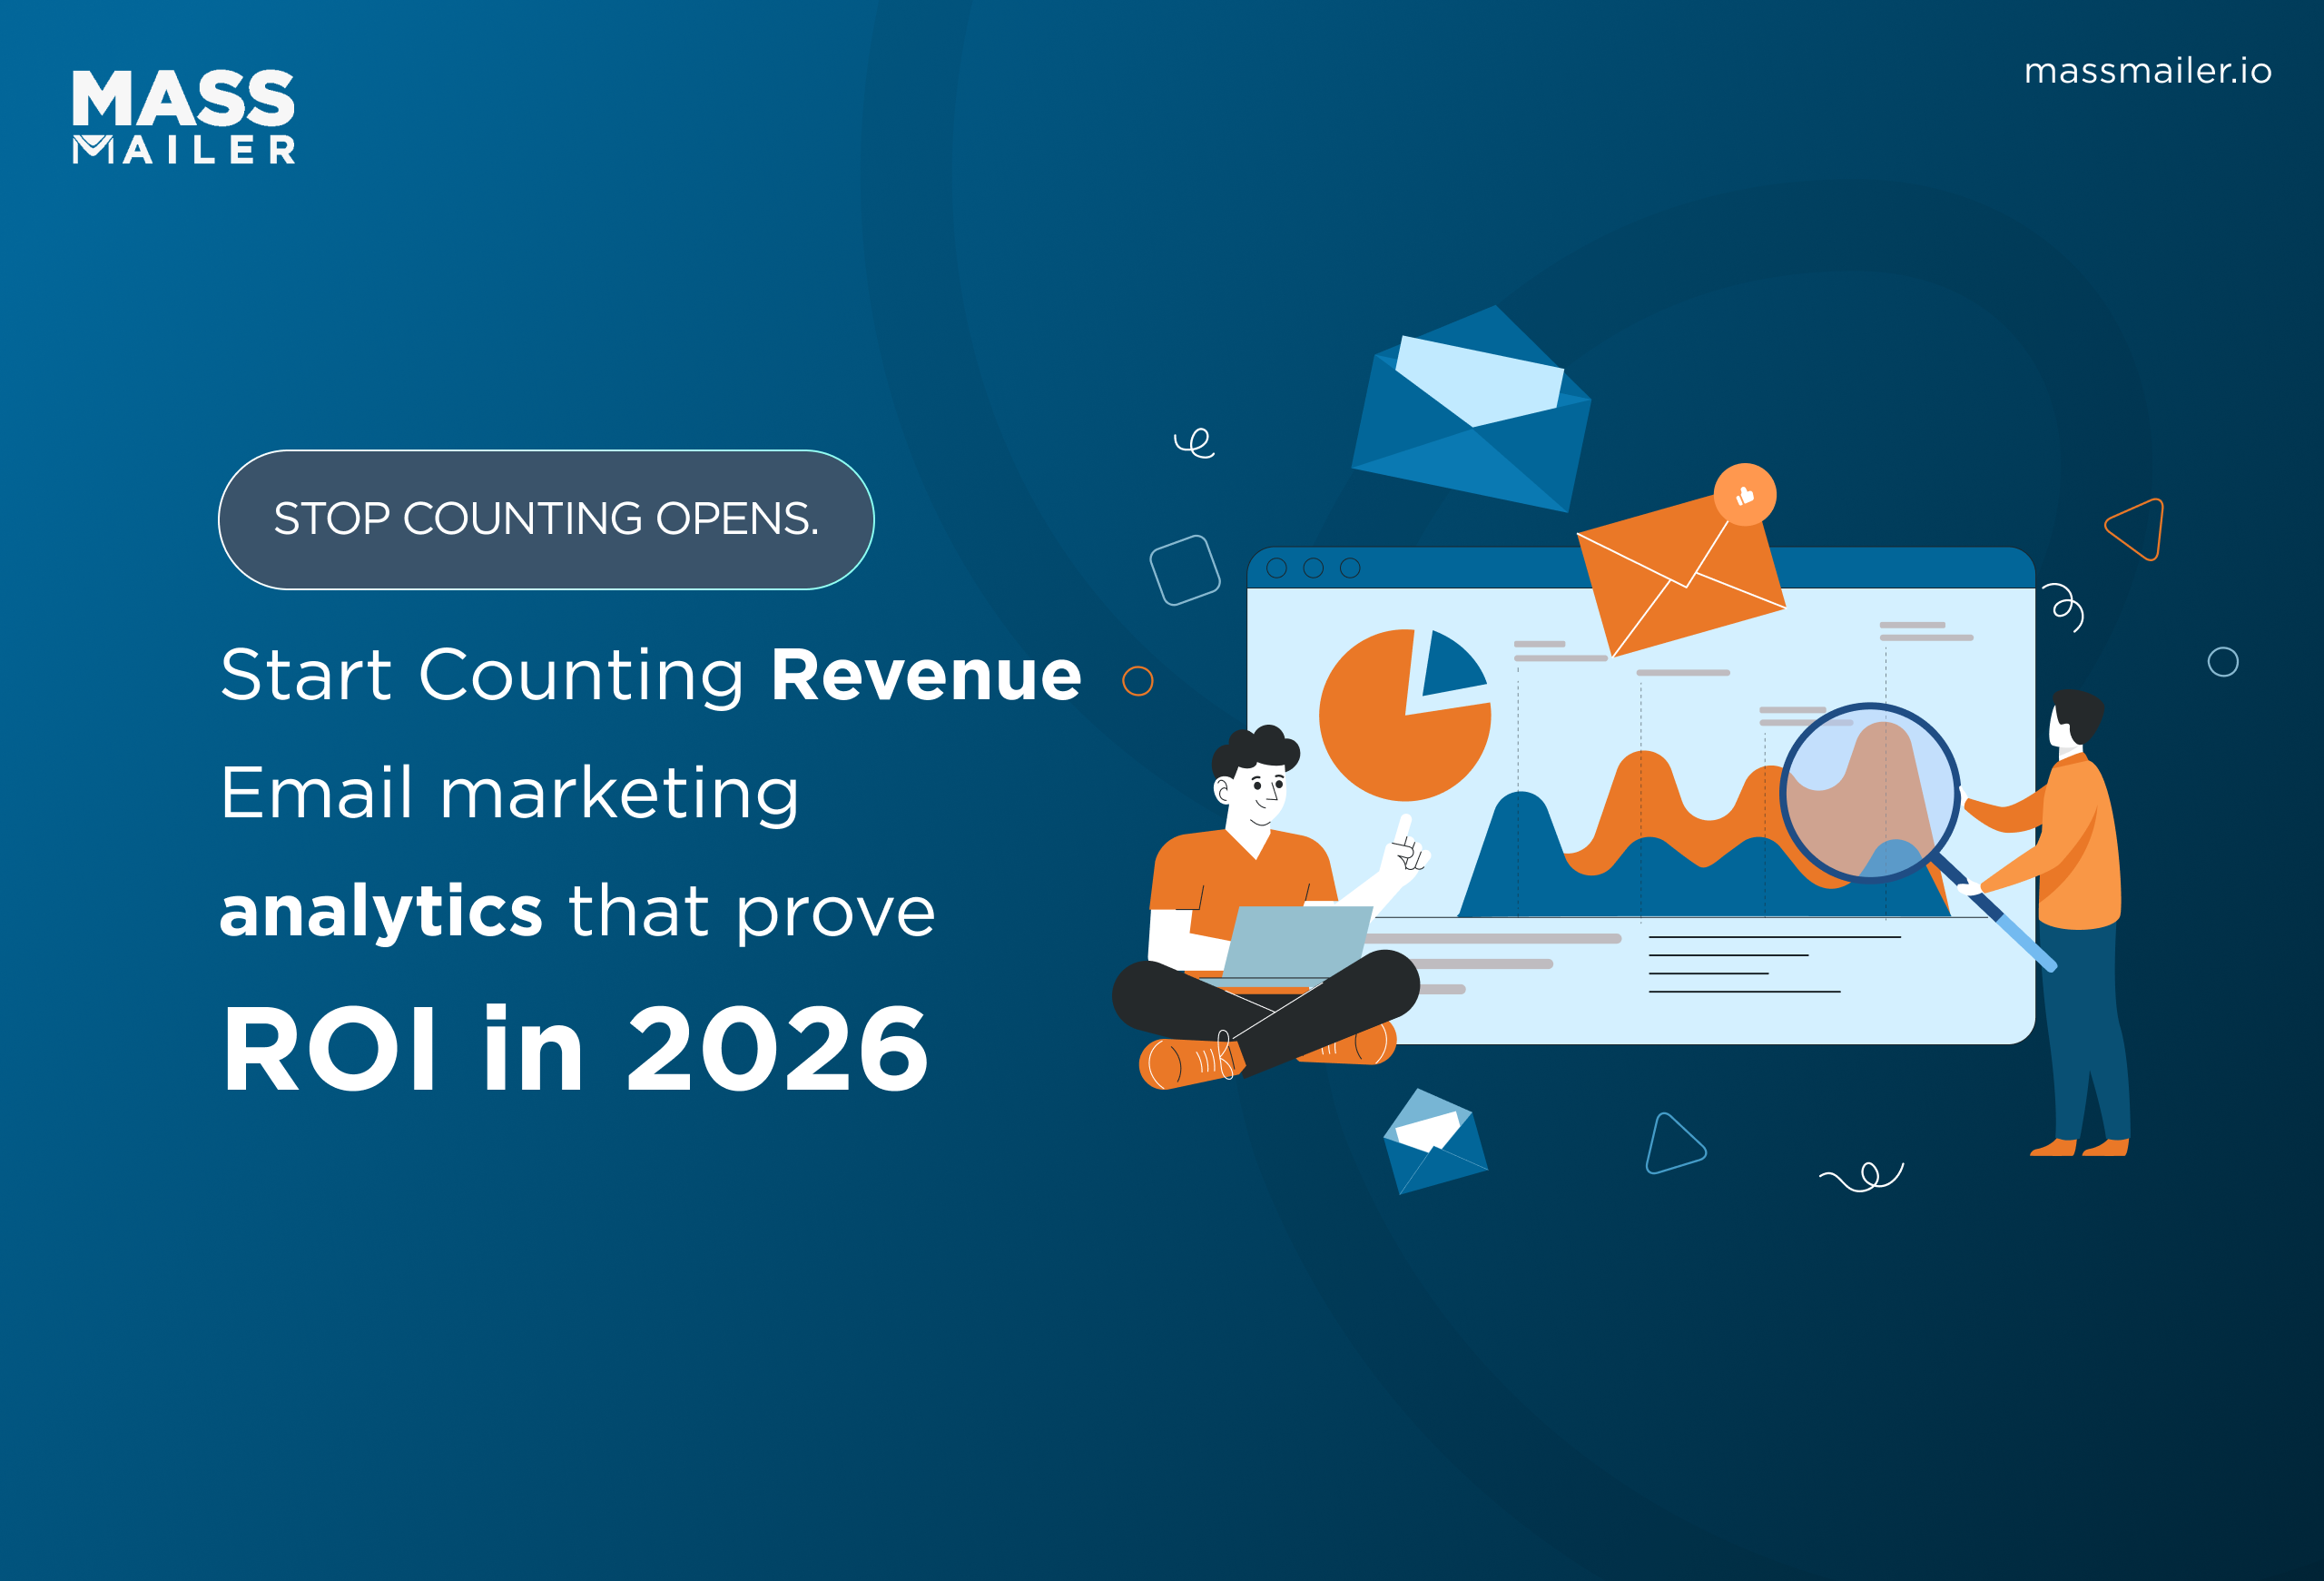
Email marketing analytics earns its keep only when it measures action and revenue, not opens. After Apple MPP, the numbers that hold up are clicks, conversions, and revenue per recipient, judged against your own baseline.
- Stop reporting open rate as success. MPP inflates it to roughly 73% proxy noise, so lead with CTR, CTOR, and conversion rate.
- Benchmark against your own last three sends, not industry averages that swing from 1.7% to 3.4% by sector.
- Grade automations on cumulative revenue per recipient, then rewrite the sequence step where engagement drops off.
- Credit nurture emails with even-weight multi-touch attribution instead of last-click, which overstates the final send.
Introduction
Your email reports are full of numbers, yet you still cannot tell which campaigns drive revenue. Email marketing analytics should answer that question, but most dashboards bury the few metrics that matter under vanity stats like raw opens.
Since Apple Mail Privacy Protection started inflating open data in 2021, that confusion has only grown. You need a clear way to measure what works, prove ROI, and connect engagement to the real pipeline.
This guide breaks down the metrics and KPIs worth tracking in 2026, the formulas behind them, and how to report on email performance directly inside Salesforce.
What is email marketing analytics?
Email marketing analytics is the practice of measuring how recipients interact with your campaigns, then using that data to sharpen targeting, content, and revenue. It turns raw send data into decisions: which subject lines earn attention, which links drive clicks, and which segments actually convert.
At its core, analytics tracks three layers. Delivery confirms whether the email reached the inbox at all. Engagement shows how recipients respond through opens, clicks, and replies. Outcome connects those actions to conversions, revenue, and retention. Strong programs read all three together, because a high open rate means little when nobody clicks or buys.
Most teams pull these numbers from their sending platform. The harder part is connecting them to the customer record so you can act on them. When email tracking data lives in your CRM next to the deal stage and lifecycle, you can segment, score, and trigger follow-up based on real behavior.
That connection separates reporting that looks good in a slide from reporting that changes what your team does next.
Email marketing metrics and KPIs to track in 2026
Track the metrics that map to a business outcome, not every number your platform reports. Five KPIs carry most of the signal in 2026, and each one answers a specific question about campaign health.
Learn the formula behind each, because the formula tells you what the number actually measures.
The core metrics and their formulas
Here are the core email marketing metrics to track, with the math for each:
- Click-through rate (CTR): unique clicks divided by emails delivered. It shows whether your content and offer earned action. Sinch Mailgun's 2024 data puts average click-through rates between 1.7% and 3.4% across industries, so judge your number against your own segment rather than a blended average.
- Click-to-open rate (CTOR): unique clicks divided by unique opens. It isolates how well the message turned attention into action, separate from the subject line.
- Conversion rate: completed goals divided by emails delivered. This ties email to purchases, signups, and demo requests.
- Bounce rate: bounced emails divided by emails sent. Hard bounces flag dead addresses; soft bounces flag temporary issues like a full inbox.
- Spam complaint rate: complaints divided by emails delivered. Keep it under 0.1%, because mailbox providers throttle senders who cross that line.
Which KPIs deserve the most weight
Weigh the metrics that take deliberate action or connect to revenue. After MPP, a click means more than an open, and money means more than a click. That gives you a simple priority order for any report:
- Lead with revenue metrics: conversion rate and revenue per recipient tie email directly to money, so they sit at the top of every executive report.
- Then engagement metrics: CTR and CTOR depend on a real click, so they read interest more honestly than open rate.
- Watch list-health metrics: unsubscribe rate, list growth, and spam complaint rate warn you early when an audience is decaying, or deliverability is slipping.
Revenue per recipient earns its place by dividing total revenue by emails delivered, which puts a 5,000-person campaign and a 50,000-person blast on equal footing. List health adds the other half of the picture. Every list decays as subscribers change jobs, abandon addresses, or lose interest, so steady net growth signals a program replacing churn faster than it loses it.
Watch the spam complaint trend in the same view, because a climbing complaint rate is an early signal that mailbox providers may start throttling your inbox placement.
From there, narrow the field. Pick three to five KPIs tied to one goal, then report them on a fixed cadence. A revenue campaign leads with conversion rate and revenue per recipient; a re-engagement campaign leads with CTR and unsubscribe rate.
Too many metrics scatter attention, so disciplined email marketing KPIs and reporting beat a crowded dashboard every time.
How Apple Mail Privacy Protection changed open rate tracking
Apple Mail Privacy Protection (MPP) made open rate unreliable by pre-loading tracking pixels, whether or not the recipient ever reads the email. Because the pixel fires automatically, every protected recipient registers as an "open," which inflates the number well above real human attention.
The scale is hard to ignore. Validity Reports found that Apple's Privacy Proxy drove 73.11% of all pixel-firing events between January and August 2024. When most of your "opens" come from a proxy rather than a person, open rate stops measuring engagement and starts measuring Apple's prefetch schedule.
So track the metrics that a machine cannot fake. A click takes a deliberate human action, so CTR and CTOR read genuine interest far better than open rate, conversion rate, and revenue per recipient track what happens after the click.
One fix matters most here: define re-engagement and inactivity by clicks rather than opens, or you will wrongly suppress active Apple users who never trip the open pixel.
Email open rate still has a narrow use as a relative trend within your own list, where a sudden drop in the rates can flag a deliverability problem before it spreads. Just stop reporting it as a headline metric.
How to measure email campaign performance step by step
Measure email campaign performance by setting a goal first, then tracking the few metrics that prove whether you hit it. A repeatable process keeps reporting consistently across campaigns and makes results comparable over time. Follow these steps in order, because each one feeds the next.
The six-step measurement process
- Define one primary goal per campaign. Decide upfront whether the send aims for revenue, signups, bookings, or re-engagement. The goal determines which KPI is primary and which are supporting.
- Set a baseline and a target. Pull your last three to five comparable sends and average their results. That baseline tells you whether a new campaign actually moved, instead of guessing against an industry number.
- Clean the list before you send. Verify addresses to cut bounces and protect sender reputation, since a dirty list distorts every downstream metric. Strong email verification keeps your denominators honest.
- Track delivery and engagement during the send. Watch delivery rate, CTR, CTOR, and spam complaints in the first 24 to 48 hours, where most engagement happens. A spike in complaints or bounces means stop and diagnose before the next batch.
- Attribute the outcome. Connect clicks to conversions using UTM parameters and your CRM, so you can credit revenue to the specific email and segment that earned it.
- Report on a fixed cadence. Summarize each campaign against its baseline, then review weekly or monthly. Consistent timing turns scattered numbers into a trend you can act on.
Avoid the two most common measurement errors
Two details separate a reliable process from a misleading one. First, always measure rates against delivered emails rather than emails sent, because bounces never had a chance to engage and they deflate your numbers.
Second, give each campaign a tracking window before you call it: most clicks land within 48 hours, but high-consideration B2B offers can pull conversions for a week or more. Closing the books too early understates the campaigns that drive your largest deals.
Automated sequences deserve their own read, because they behave differently from one-off campaigns. A drip campaign compounds over weeks, so measure it by cumulative conversions and revenue per recipient rather than a single open or click.
Look at each step's drop-off, too, since the step where engagement falls off is the one to rewrite first. When you score automation by outcome instead of activity, you see which steps in the sequence actually pull weight.
How to calculate email marketing ROI and attribute revenue
Calculate email marketing ROI with a simple formula: subtract the cost of the program from the revenue it generated, divide by the cost, then multiply by 100. If email drove $50,000 in revenue and cost $5,000 to run, your ROI is 900%. The math is easy; the discipline is in attributing revenue accurately, which is where most teams lose the thread.
Count every cost and benchmark the return
Get the cost side right first, because an undercounted denominator inflates ROI and hides waste. Include your platform or sending fees, the share of staff time spent on production, any design or copy spend, and the cost of list tools like verification. Once the total cost is honest, the revenue side becomes the real challenge.
Email still earns its reputation as the highest-return channel. Litmus reported in its State of Email 2025 survey that 30% of marketing leaders see between $36 and $50 back for every $1 spent, and that the share of teams that do not measure ROI at all fell to 21%, down from 36% in 2023.
The takeaway is direct: more teams now hold email accountable to revenue, so your reporting needs to do the same.
Attribute revenue with multi-touch reporting
Attribution decides whether your ROI number is trustworthy. Single-touch models assign all the credit to one email, usually the last click before purchase, which overstates that send and hides the nurture that set it up.
Multi-touch attribution spreads credit across every email a buyer engaged with on the path to conversion, so a welcome sequence, a mid-funnel offer, and a final reminder each get their fair share.
Say a buyer clicks a welcome email, then a product-launch email two weeks later, then converts from a final reminder on a $1,200 deal. Last-touch attribution credits the reminder with all $1,200 and makes the welcome and launch emails look worthless. An even-weight multi-touch model splits the credit into $400 each, which correctly shows that the nurture sequence carried two-thirds of the work. Cut either the earlier email, and the deal likely stalls.
For most B2B teams, multi-touch reporting reflects reality far better, because deals rarely close on a single email. To run it well, you need every touch recorded against the same customer record, with consistent campaign tracking from first click to closed deal.
When clicks, opens, and conversions all attach to the contact in your CRM, multi-touch attribution stops being a spreadsheet exercise and becomes a live view of which campaigns build the pipeline.
Tracking email analytics inside Salesforce
The cleanest way to measure email is to keep the data in the same system that holds your customer records. When opens, clicks, bounces, and replies attach to the Lead or Contact, you report on engagement next to deal stage, lifecycle, and revenue, with no export and no second database to reconcile. That single source removes the gap between what marketing sends and what sales sees.
Why native tracking beats exporting data
This is exactly the gap MassMailer closes as a Salesforce-native tool. MassMailer runs entirely inside Salesforce and records every engagement event directly on the record it belongs to, so a rep opening a Contact sees that person's full email history in context.
Because campaigns target live Leads and Contacts, the status of each send, from delivered to opened to clicked to bounced, lands on the Campaign Member without leaving the platform.
That changes the daily workflow in concrete ways. Marketing Cloud, Mailchimp, and most standalone tools keep engagement in their own database, so reporting means exporting a CSV or maintaining a sync that drifts out of date.
With a native tool, the data already sits on the Campaign Member and the Contact, so your reports read live records. When a buyer clicks, the timestamp writes to their record immediately, and a sales rep can act on it inside the same screen where they manage the deal.
Report on engagement with Salesforce tools
From there, you measure performance with tools you already use:
- Reports: build a Campaign Members report grouped by status to see CTR, bounces, and conversions per campaign.
- Dashboards: add components for click trends, bounce rate, and revenue by segment, then refresh them on your reporting cadence.
- List views and filters: segment by engagement to re-target clickers or suppress hard bounces before the next send.
- Role-based access: reporting follows your existing Salesforce roles, so reps and leaders see only the data their permissions allow.
This native approach also fixes the attribution problem from the last section. Because every touch records against the same Lead or Contact, a multi-touch report can follow a buyer from first click to closed Opportunity without stitching data across tools. Since the email tracking writes to native objects, your attribution and ROI math run on the records your pipeline already lives in.
Conclusion
Strong email marketing analytics comes down to a few honest metrics, measured the same way every time. Choose three to five KPIs that map to revenue, lean on clicks and conversions now that Apple MPP has muddied open rate, and hold every campaign accountable with a clear ROI formula and multi-touch attribution. The teams that report consistently are the ones who can prove email's value and improve it.
The last step is keeping that data where you can act on it.
MassMailer records every open, click, and bounce on the Salesforce record it belongs to, so your reports, dashboards, and ROI math all run inside the CRM your pipeline already lives in.
Start a free MassMailer trial and measure your next campaign's performance without exporting a single row.
Frequently Asked Questions
1. What is email marketing analytics?
2. Which email marketing metrics matter most?
3. How do you calculate email marketing ROI?
4. Why are my email open rates inaccurate?
5. What is a good email click-through rate in 2026?
6. How do you track email analytics in Salesforce?
Start Your Free Trial Today
Experience MassMailer the easiest way to send personalized emails from Salesforce.
MassMailer Resources


About the Author

Siva Devaki 
Siva Devaki is the founder of MassMailer Inc., a tool that helps Salesforce users optimize email marketing. A passionate advocate for email marketing, Siva writes and hosts podcasts on the topic, sharing insights to help businesses drive revenue and enhance customer engagement through Salesforce email automation and tracking.