


Table of Contents
Search "email scoring," and you land on five tools with five different definitions. None of them say which one fits your program. It can mean subscriber engagement, sender reputation with mailbox providers, or how likely a lead is to convert.
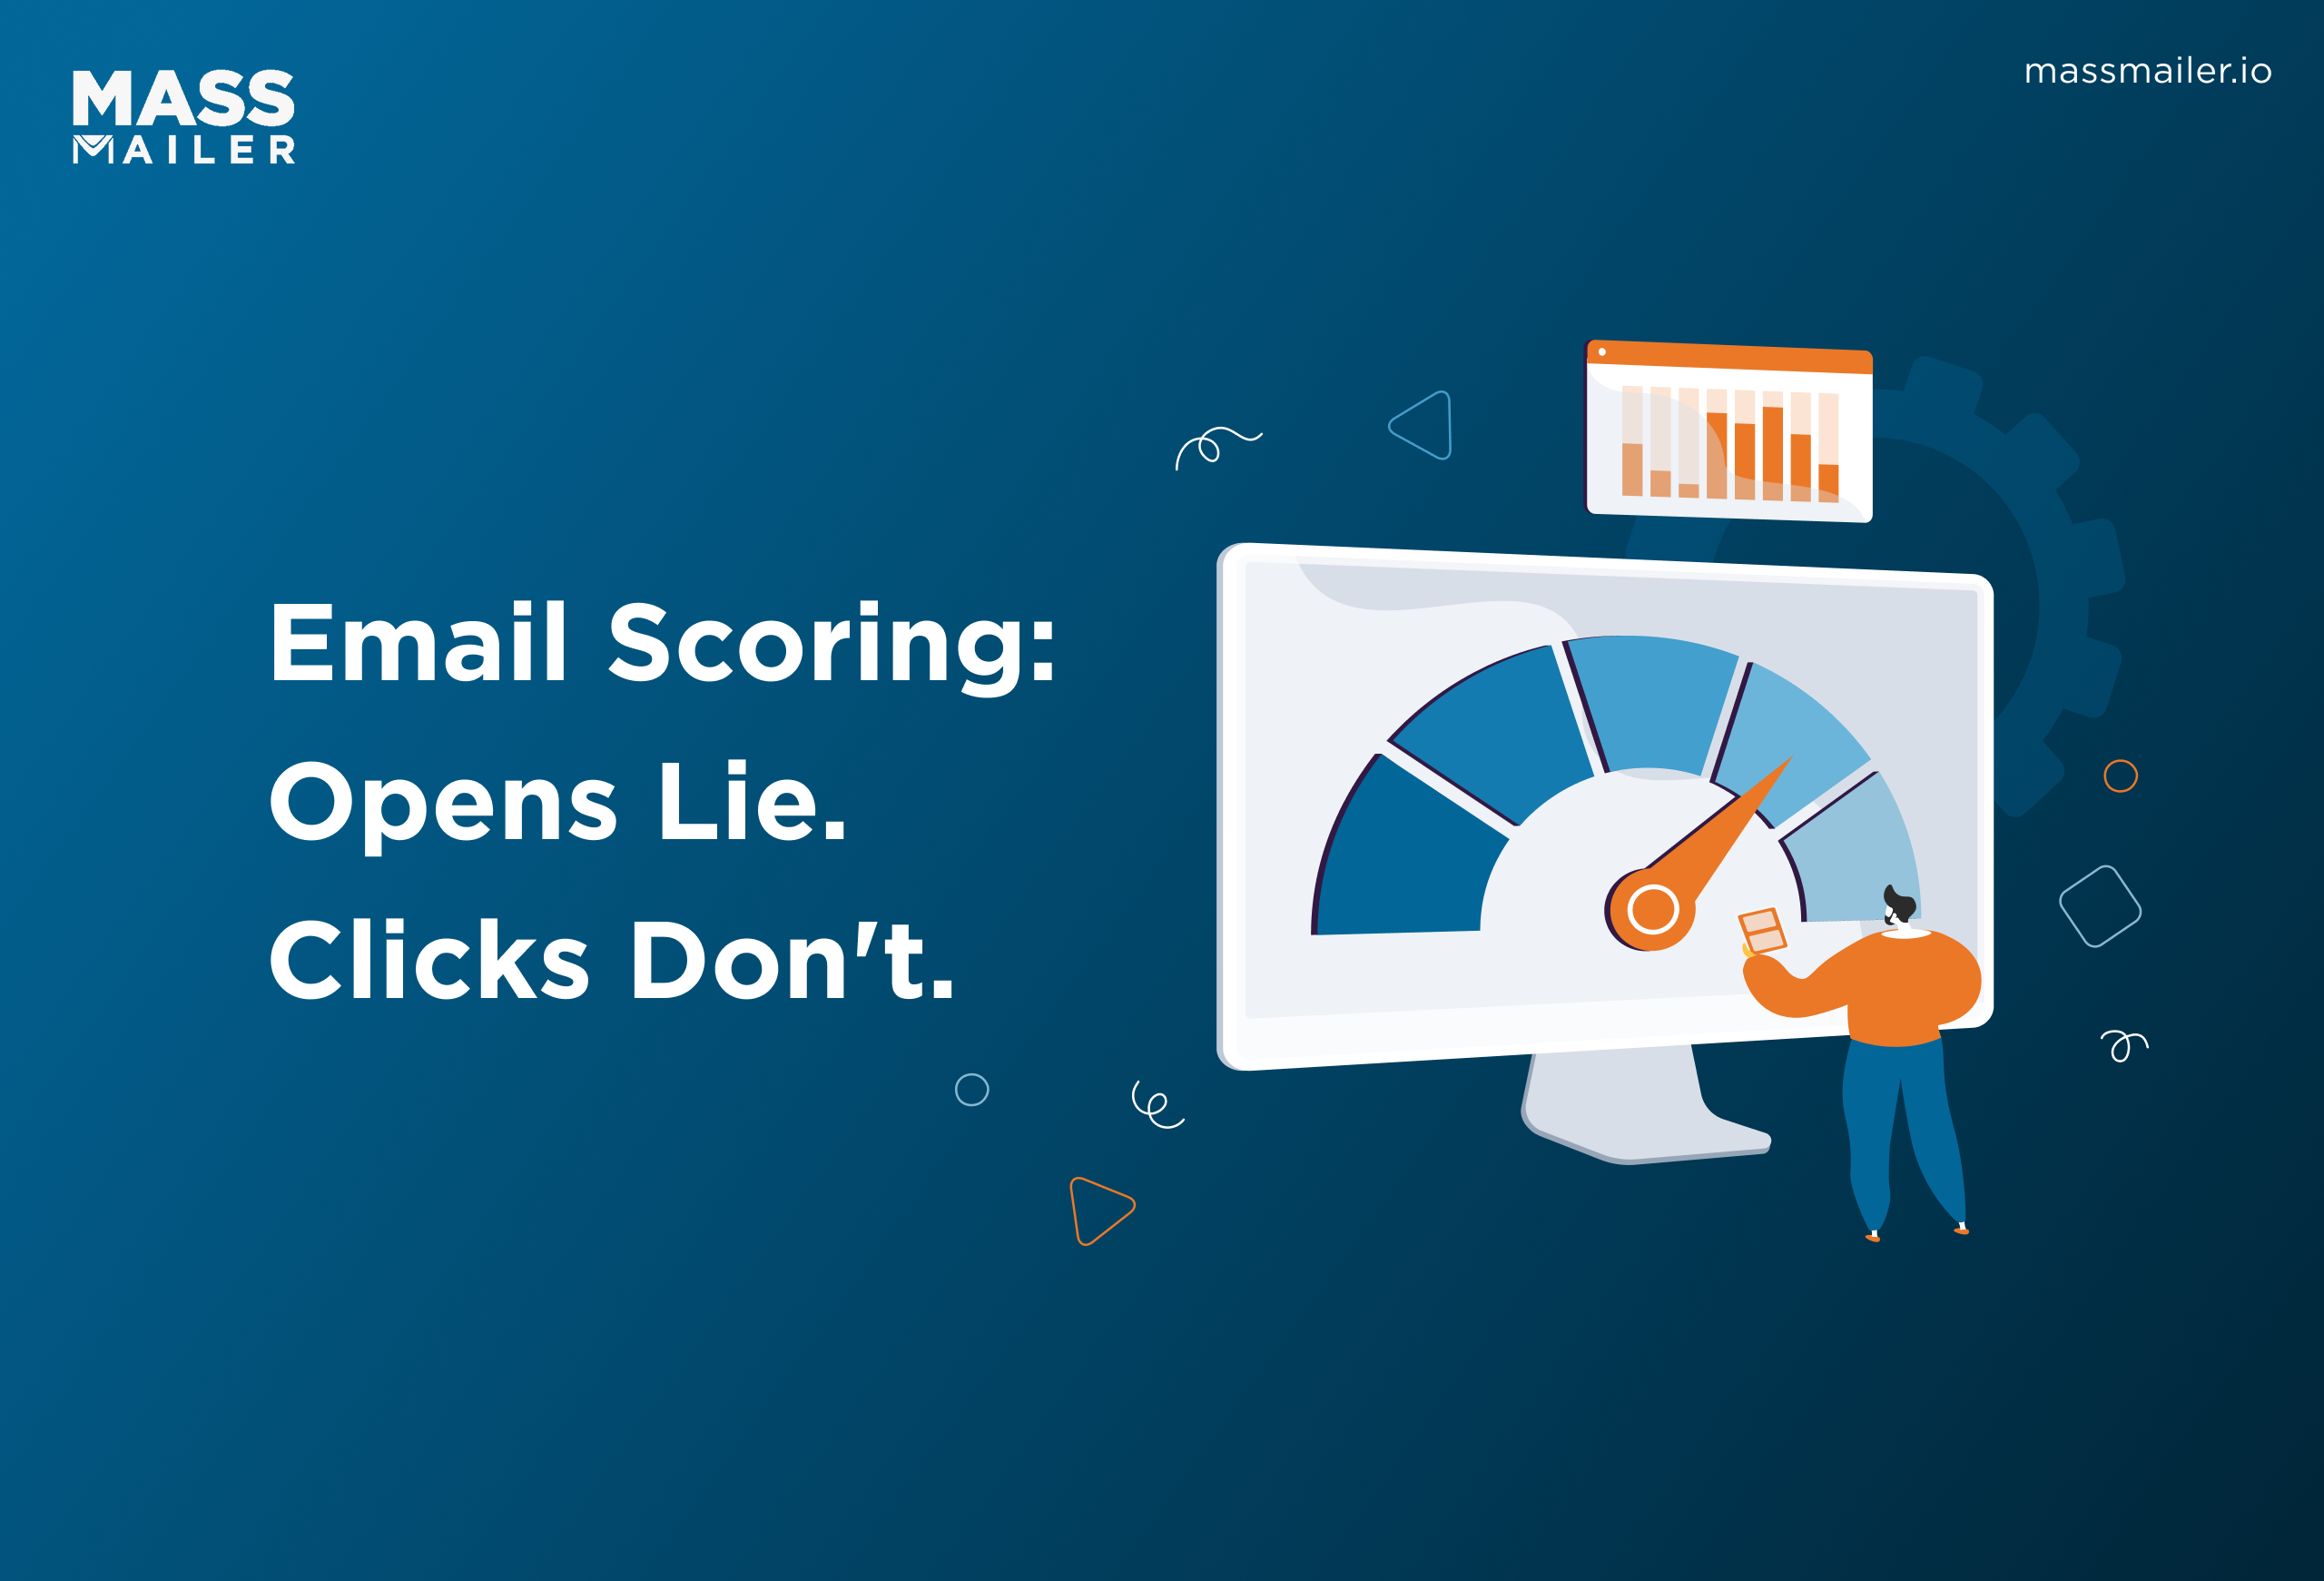
A high score on one says nothing about the other two. Before you trust a number, you need to know which measurement produced it. This guide covers what each type of email scoring measures, the formula behind an engagement score, what a healthy range looks like, and how to rebuild one that's slipping.
What "Email Scoring" Actually Measures
Email scoring covers three different measurements, and each one answers a different question.
- Email engagement score: how actively a subscriber opens, clicks, and replies to your campaigns, rolled into one number
- Sender score: how mailbox providers like Gmail and Outlook rate your sending domain's reputation
- Email lead score: how likely a contact is to convert, using email behavior as one signal among several
Email Engagement Score
Engagement scoring is usually weighted, so a reply counts for more than an open, and a click sits somewhere in between. It tells you who is still paying attention. It says nothing about whether your emails are reaching the inbox in the first place.
Sender Score (Deliverability Reputation)
A poor sender score builds from bounce rates, spam complaints, and blocklist history against your domain. It has little to do with any single subscriber's behavior. A domain can carry a poor sender score while individual subscribers open and click every send, because domain-level deliverability and subscriber engagement are measured at different levels.
Email Lead Score
An email lead score rates how likely a contact is to convert, using email opens and clicks as one input among several. It usually sits inside alead scoring model with job title, company size, and pipeline stage, not as a standalone number.
How to Calculate an Email Engagement Score
An engagement score assigns a weight to each action a contact takes, totals those weights, and normalizes by how many emails that contact received.
The Formula and What Each Signal Is Worth
Score = (Opens × 1 + Clicks × 3 + Replies × 5) ÷ Emails Sent × 100
The weights reflect intent strength, not arbitrary preference.
Opens sit at 1 because Apple Mail Privacy Protection inflates them. Since September 2021, every email opened through Apple Mail auto-registers an open regardless of whether anyone reads it.
According to Litmus, over 50% of all email opens now come from devices with MPP activated, which means at least half the opens in a typical campaign are pre-loaded by Apple's servers before any human sees the message. So weighting opens at 1 keeps them in the formula without letting phantom activity distort the number.
Clicks earn a 3× weight because clicking requires a deliberate decision. A contact who clicks a pricing link or a case study download has moved past scanning into active interest. That behavioral gap between opening and clicking is large enough that most scoring models weight clicks at 2-5× opens.
Replies get the highest weight. A reply means the contact wrote back. In Salesforce, that shows up as a logged EmailMessage on the Activity timeline. It is the clearest engagement signal you can capture.
These weights are a starting point, not a rule. If your program sends mostly transactional emails (order confirmations, password resets), clicks matter less because the content is not designed to drive them. Adjust weights to match what meaningful engagement looks like for your sending pattern.
Worked Example on a Salesforce Contact Record
Pull up a Contact in Salesforce. Under Activity History, count the last 90 days of email interactions: 8 opens, 3 clicks, 1 reply across 20 emails sent.
Score = (8 × 1 + 3 × 3 + 1 × 5) ÷ 20 × 100
Score = (8 + 9 + 5) ÷ 20 × 100
Score = 22 ÷ 20 × 100
Score = 110
Anything above 100 means the contact engages more than once per email on average. That is a high-value contact worth routing into a dedicated nurture sequence or flagging for sales.
The Mistake That Inflates Every Score
The most common inflation in Salesforce happens when a single click registers twice. A contact clicks a link in a Campaign email. Salesforce logs the click on the EmailMessage record AND flips the Campaign Member Status to "Responded." If your scoring pulls from both sources, that one click counts double.
The fix is straightforward: pick one source. Either pull from EmailMessage activity records or from Campaign Member Status, but never both.
What a Good Engagement Score Looks Like
A good email engagement score falls between 50 and 100 on a weighted scale where opens = 1, clicks = 3, and replies = 5. Scores above 100 signal a highly active contact. Below 20, the contact is effectively dormant.
- Above 100: Highly engaged. Opens, clicks, and sometimes replies. Route into an accelerated nurture sequence or flag for sales outreach.
- 50 to 100: Moderate engagement. Opens most emails, clicks occasionally. Worth keeping in your regular cadence, but not ready for a sales handoff.
- 20 to 50: Low engagement. Opens sporadically, rarely clicks. Check whether sending frequency or content mismatch is driving the drop before writing them off.
- Below 20: Near-dormant. Barely interacts. Move to are-engagement sequence with a clear opt-out path. Continuing to send at full volume to dormant contacts hurts deliverability for everyone else on your list.
If you adjust the weights, recalibrate these thresholds accordingly. Published benchmarks rarely apply because every list, sending cadence, and industry skews the numbers differently. A relative baseline built from your own data is more reliable.
How to Set Your Own Baseline
Calculate the median engagement score across your active list over the last 90 days. In Salesforce, anemail report grouped by Contact with summary columns for total opens, clicks, and replies produces the raw data in a single run. Apply the formula to each row, sort by score, and find the median.
That median becomes your baseline. Contacts above it are engaged. Contacts below it need attention. Recalculate every quarter, as your content, frequency, or list composition shifts, so does the median. A baseline set in January may not reflect your sending pattern by April.
What Tanks an Engagement Score
Two operational problems tank engagement scores faster than bad content: list decay and send cadence mismatches. Both distort the inputs your formula depends on, and in Salesforce, both hide in plain sight because the default reports do not flag them.
List Decay Inflates the Denominator
Stale contacts are the most common reason engagement scores decline without any change in content quality. Every email sent to a contact who will never engage again inflates the denominator of the score formula while the numerator stays flat. As contacts change roles, bounce, or simply go dark, scores drift downward across the board.
In Salesforce, this shows up as a growing gap between total EmailMessage records on a Contact and any recent Activity with an open, click, or reply. A Contact with 40 emails sent and zero clicks in the last 90 days drags down your list-level average, and no out-of-the-box report separates their score from everyone else's.
The diagnostic check: filter your engagement score report to contacts with at least one click in the last 90 days. If the median jumps significantly, list decay is the problem, not your content.
Send Cadence Mismatches Punish Every Signal
Sending at the wrong frequency damages every signal in the engagement score formula. Send too frequently and contacts stop clicking, start ignoring, and eventually mark you as spam. Send too infrequently, and they forget who you are, which tanks open rates on the next campaign because the sender name no longer registers.
In Salesforce, cadence mismatches often happen silently when contacts sit in multiple Campaign Member lists and receive overlapping sequences. Onedrip campaign sends on Tuesday, another on Thursday, and the contact sees five emails in a week from the same org without anyone on your team realizing it.
Both directions damage the same email engagement metrics your score relies on:
- Over-sending: Clicks drop as inbox fatigue sets in. Unsubscribes rise, and spam complaints compound the problem by hurting deliverability on future sends.
- Under-sending: The next email after a long gap lands cold. Open rates dip, clicks fall further, and the score captures that silence as disengagement rather than a timing gap.
Left unchecked, both problems compound. List decay inflates the denominator quarter after quarter while cadence mismatches erode the numerator. The score drops, but the root cause never surfaces in a standard Salesforce report.
How to Rebuild a Slipping Score
A declining engagement score is a list problem before it is a content problem. The fix starts with separating contacts who still interact from contacts who stopped months ago, then adjusting how and when you send to each group.
Segment by Recency Before the Next Send
The fastest way to recover a slipping score is to stop sending to contacts who are no longer engaging. Split your active list into three segments based on the last recorded click or reply, not the last open.
- Engaged (clicked or replied in the last 30 days): Keep sending at your current cadence. These contacts are actively interacting, and their scores reflect real behavior.
- Cooling (last click 31 to 90 days ago): Reduce frequency by half and test a different subject line angle or content format. They haven't disengaged completely, but something in the current approach isn't landing.
- Dormant (no click in 90+ days): Pull them out of your main campaigns entirely. Run a short re-engagement sequence with a clear opt-out. Contacts who don't respond after two or three attempts should be suppressed from future sends.
This single round ofcontact segmentation removes the deadweight dragging your list-level score down without losing anyone who might still convert.
Re-Score on Live Activity, Not a Static Import
Engagement scores decay fast if you calculate them once and let the number sit. A contact scored at 85 three months ago may be at 30 today if they haven't clicked since.
Recalculate scores on a rolling window tied to your sending cadence. If you send weekly, a 90-day window captures roughly 12 touchpoints. If you send monthly, extend to 180 days so the window holds enough data points to be meaningful.
This is where a Salesforce-native email tool changes the workflow. MassMailer logs opens, clicks, and replies at the individual message level directly inside Salesforce, so recalculating on live activity data replaces the manual export-and-reimport cycle most teams default to. Scores stay current because the underlying data updates with every send, not every quarterly batch import.
Start Measuring Email Engagement That Actually Converts
Email scoring turns raw email activity into a number you can act on. The formula is straightforward. The value comes from what you do with the output: segmenting by engagement tier, catching list decay before it drags down deliverability, and recalculating on live data instead of a quarterly snapshot.
Start with the weighted formula from this guide, set a baseline from your own list, and let the scores surface which contacts deserve more attention and which ones need a different approach. MassMailer makes that loop practical inside Salesforce by keeping every open, click, and reply available for scoring without a manual data pull.
Frequently Asked Questions
1. What is the difference between email scoring and email validation?
2. Is email scoring the same as spam score?
3. Does email scoring work for cold email campaigns?
4. Can you measure email engagement without tracking pixels?
5. Does email scoring apply to B2C or only B2B?
6. What happens to engagement scores when you switch email platforms?
Start Your Free Trial Today
Experience MassMailer the easiest way to send personalized emails from Salesforce.
Related Blogs
Email Deliverability Best Practices to Reach the Inbox
Best Time to Send Marketing Emails (2026 Data)
MassMailer Resources


MassMailer Glossary
About the Author

Siva Devaki 
Siva Devaki is the founder of MassMailer Inc., a tool that helps Salesforce users optimize email marketing. A passionate advocate for email marketing, Siva writes and hosts podcasts on the topic, sharing insights to help businesses drive revenue and enhance customer engagement through Salesforce email automation and tracking.