


Table of Contents
Introduction
Email is a critical part of any marketing strategy. According toLitmus, emails bring back $36 for every dollar spent, which is higher than any other channel. This underscores the necessity to monitor the performance of your email campaigns.

One way to do that is to track email statistics through timely reports and analysis. Reports help you visualize essential email metrics such as open rates, click-through rates, bounce rates, etc.
This blog takes you through the process to master MassMailer statistics, and also talks about a few new features in the latest version 2.52.
Importance of Monitoring Email Statistics
As a business, it is critical to monitor email activity to understand how your target audience responds to your campaigns. Here are a few more reasons to monitor your email statistics:
Improve Email Deliverability
Statistics like bounce rates clarify how many of yourcampaign emails did not reach their destination. They also help you understand how to maintain hygiene in your mailing lists by eliminating invalid addresses.
Optimize Campaign Performance
Analyzing email statistics on variations, times of day, and audience segments highlights the best-performing campaigns. You can then optimize other emails with the same configurations.
Measure ROI
Monitoring your email statistics enables you to measure the ROI of your campaigns. For example, tracking conversion rates helps you understand how many recipients took the desired action out of the total emails sent.
Understanding Statistics in Massmailer
MassMailer has made a few enhancements to its statistics section in the latest edit. You will find these statistics in the new section in the Outreach Object in MassMailer. The platform now offers two types of statistics:
Batch Statistics
These numbers are refreshed every hour in a batch. This setting is configurable; you can contact MassMailer for help. The statistics in this section are not detailed drill-down reports; they are just figures. You can create Salesforce or MassMailer reports using these numbers.
These statistics are available for Outreach and Campaign objects. The latter's numbers refresh every 15 minutes from the associated Outreach.
Real-Time Statistics
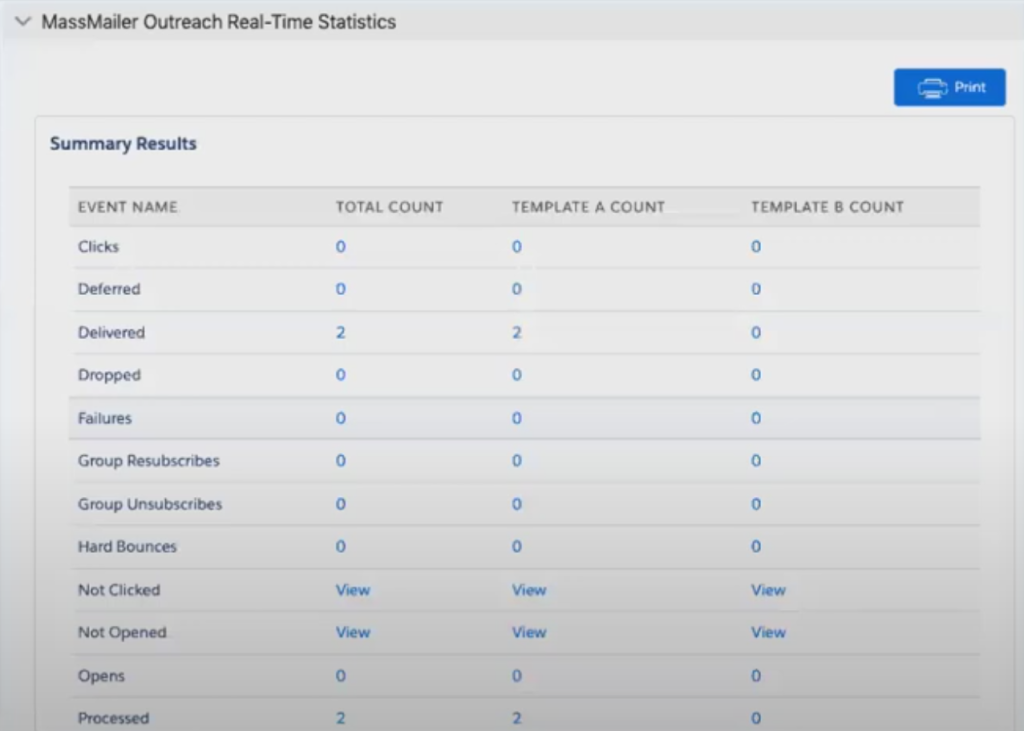
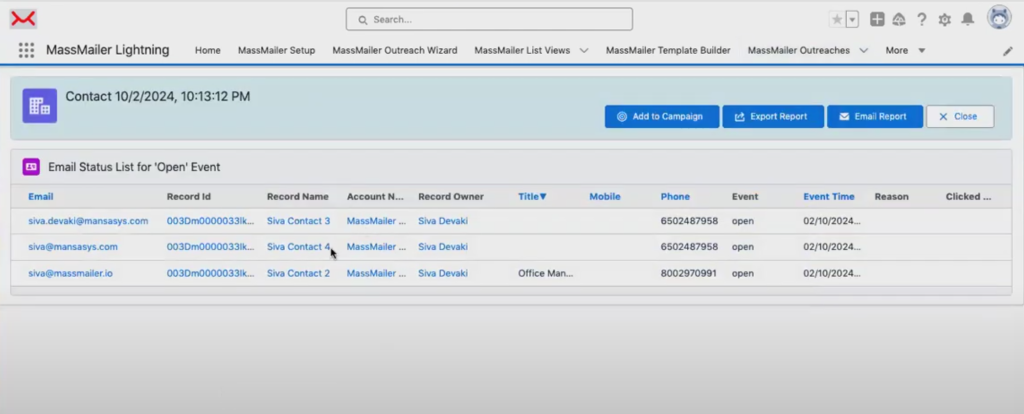
Real-time statistics in Outreach refresh each time SendGrid records a new email event. These are detailed metrics that you can click on and view more information. For example, by clicking "Opens”, you can see the campaign members who opened your emails.
You cannot compose these statistics into reports because they are not fields but real-time computations.
Event Statistics in MassMailer
MassMailer provides you with two types of events as a high-level classification: Delivery and Engagement.
Delivery Events
These are system-generated events that inform you if your emails reach their destination.
- Processed: This event triggers when SendGrid receives your email and prepares to deliver it.
- Dropped: This event signifies that the user has previously unsubscribed, the email has previously bounced, or it was reported as spam.
- Deferred: This event occurs when the recipient’s mail server is down or unable to receive emails. The deferred event shows that the email you sent was rejected repeatedly. SendGrid will try to deliver the email in up to 72 hours.
- Bounce: There are two types of Bounce. A Hard Bounce event emphasizes that your email cannot be delivered permanently, while a Soft Bounce event highlights that the recipient server is rejecting your email.
- Delivered: Highlights that your email was delivered.
Engagement Events
These are user-triggered events that occur when they interact with your emails.
- Open: This event occurs when a user opens your email.
- Click: Thisevent is fired when a user clickson any URLs in your email.
- Unsubscribe: This event highlights a user who has unsubscribed from your mailing list.
- Group Unsubscribe:This event occurs when a user unsubscribes from an email preference group.
- Resubscribe/Group Resubscribe: These events occur when a user resubscribes globally or to a specific preference group.
- Spam Report: When a user labels your emails as spam.
Additional Event Statistics
MassMailer captures several additional statistics for various email events:
- Suppressed: Shows the number of suppressed emails resulting from bounce, unsubscribe, spam report, or other rejections. MassMailer does not send these emails to SendGrid.
- Failures: This shows the number of failed emails resulting from exceeding monthly quotas or other reasons.
- Total recipients: The total number of people in the email list.
- Requests: The number of requests sent to SendGrid after MassMailer suppresses emails.
MassMailer Email Event Sequence
Let’s understand what happens in MassMailer when you send an email:
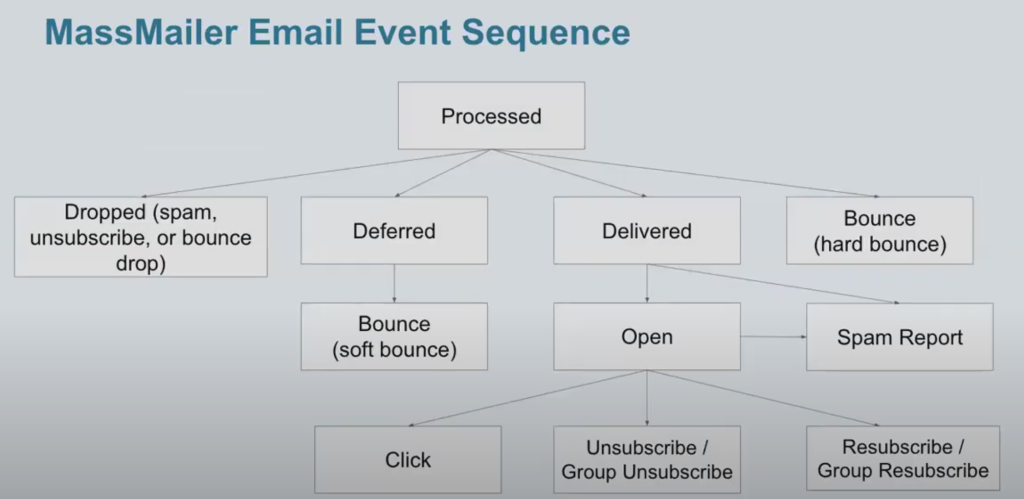
- Once you send an email, it is processed in SendGrid in a queue.
- SendGrid assesses whether the email is dropped, deferred, bounced, or delivered.
- When an email is deferred, it undergoes a “Soft bounce”.
- Based on the conditions set for the email, SendGrid may drop it because it was reported as spam or unsubscribe.
- The email may undergo a “Hard bounce”.
- When SendGrid delivers an email, users may open and interact with it. They may click on the CTA, unsubscribe, report spam, or resubscribe.
Statistics Enhancements in MassMailer 2.52
MassMailer Open Times
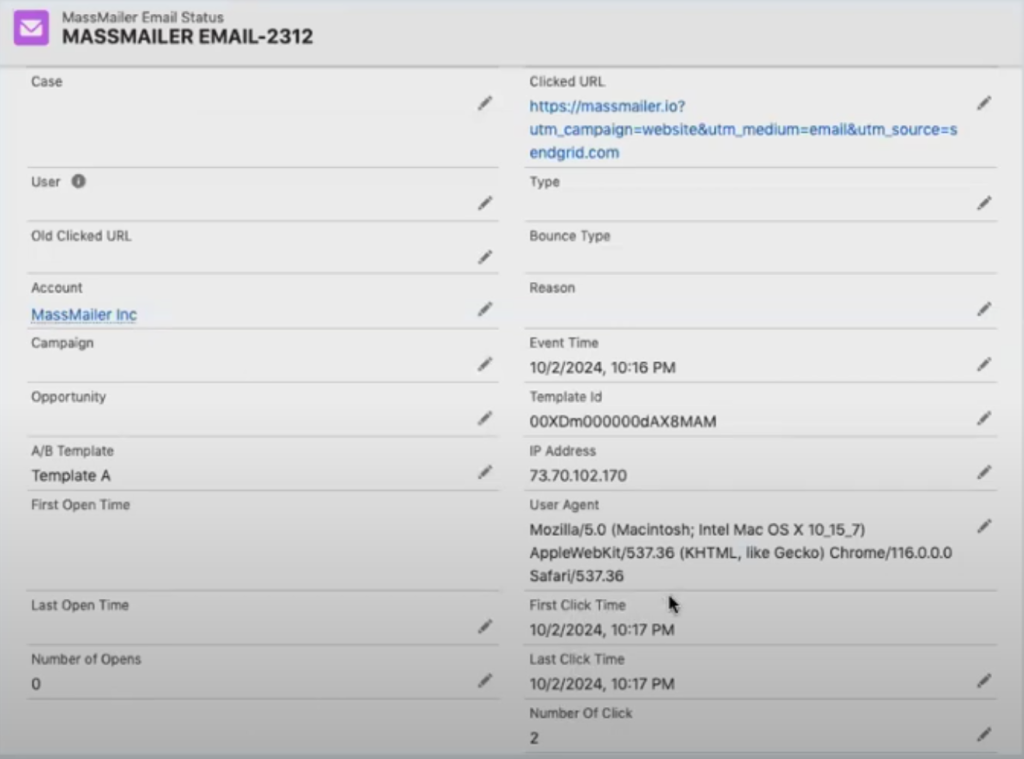
MassMailer Click Times
MassMailer introduced several statistics enhancements in the latest version:
- Total Recipients: MassMailer now displays the total number of records from the query.
- Event Merging: MassMailer does not log multiple opens and click events anymore but merges these events every hour.
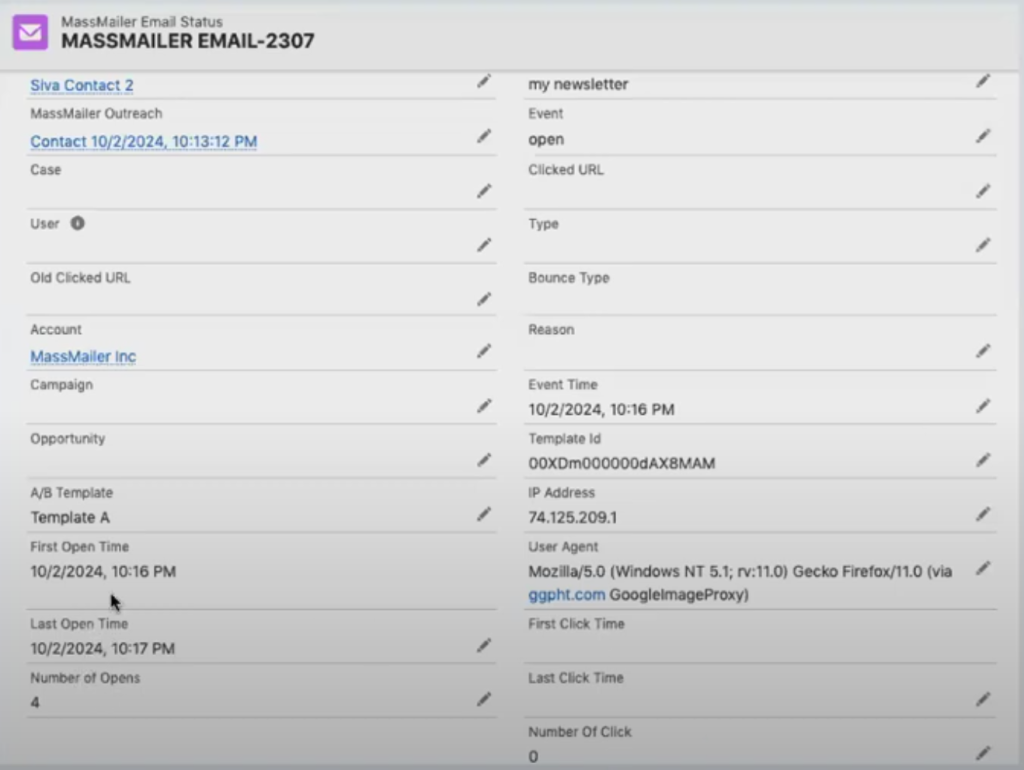
- New Fields: There are new fields for Open and Click events, including First Open Time, First Click Time, Last Open Time, Last Click Time, Number of Opens, and Number of Clicks. Each unique URL gets its statistics.
- These enhancements aim to improve data storage.
Steps to Check Outreach and Campaign Statistics in MassMailer
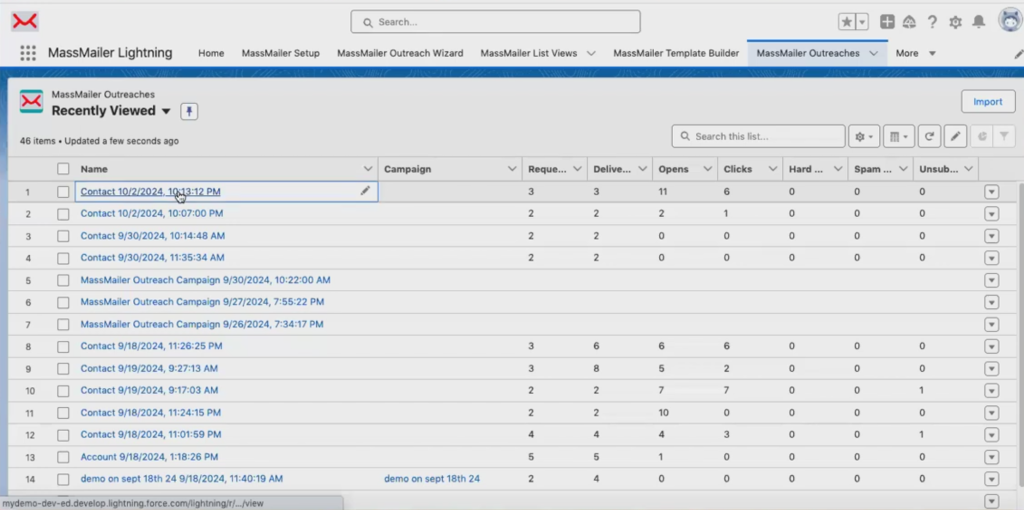
Begin by logging into your MassMailer Lightning dashboard.
- Click on the waffle icon and type “Outreach” or “Campaign”. This will open your recent outreaches/campaigns. Click on the one you want to view.
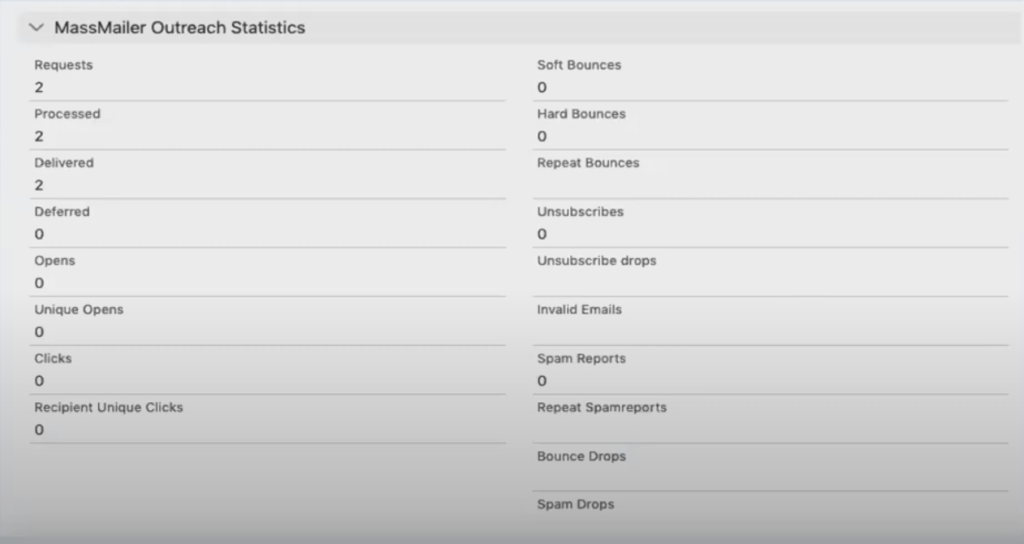
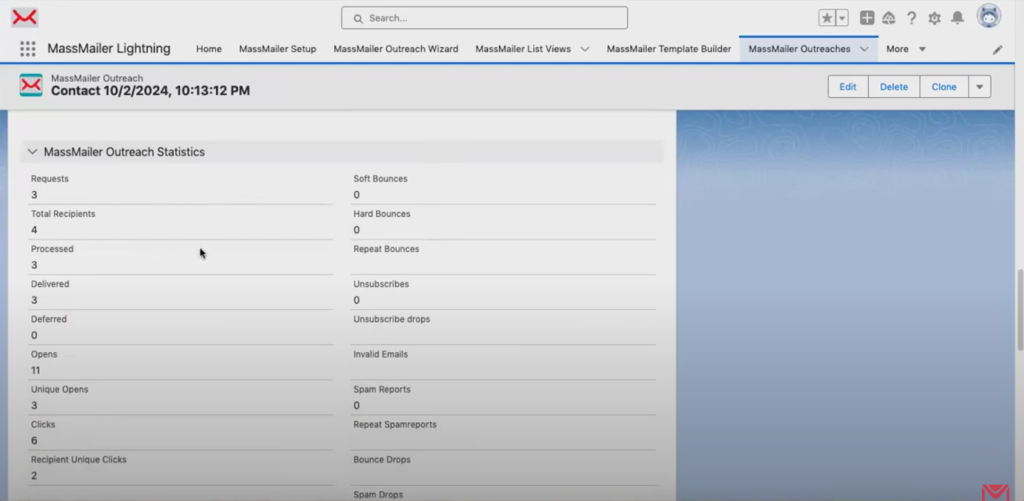
Click on the “Details” tab and scroll down. You will reach the “MassMailer Outreach Statistics” section (or the “MassMailer Campaign Statistics” section). You can view all the numbers in this section.
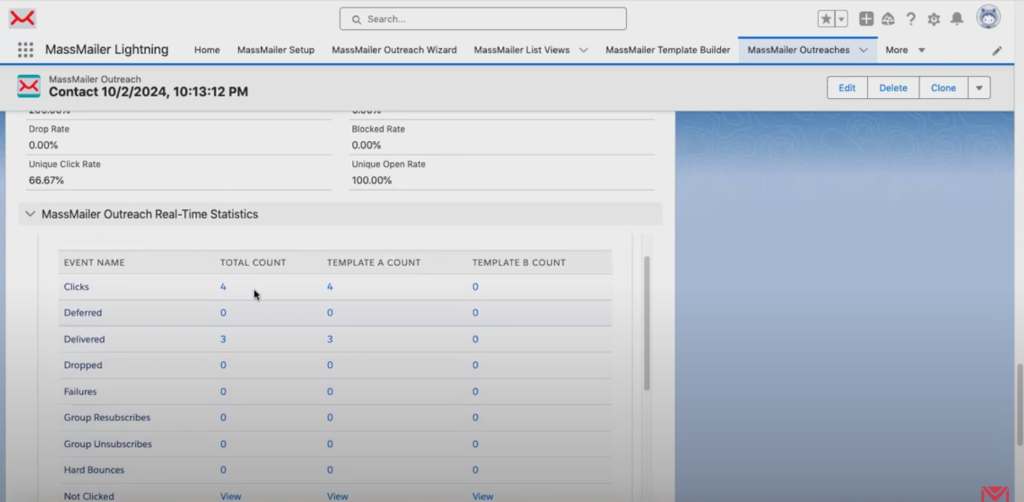
If you scroll down further, you will see “MassMailer Outreach Performance” and “MassMailer Outreach Real-Time Statistics” (and the same sections for Campaigns as well). Here, you can view all the statistics as discussed in this blog.
Enhance Email Visibility with MassMailer
Sending marketing emails is a detailed process that occurs behind your screens. From processing an email to delivering it to the recipient's mailbox, countless events occur in between. MassMailer introduces new statistics to enhance this visibility in your email campaigns.
Integrate MassMailer with your Salesforce platform to gain native bulk email capabilities with value-adding features such as workflow email alerts and spam trap removal. Visit theMassMailer websitetoday to learn more.
Start Your Free Trial Today
Experience MassMailer the easiest way to send personalized emails from Salesforce.
Related Blogs


MassMailer Resources


About the Author

Siva Devaki 
Siva Devaki is the founder of MassMailer Inc., a tool that helps Salesforce users optimize email marketing. A passionate advocate for email marketing, Siva writes and hosts podcasts on the topic, sharing insights to help businesses drive revenue and enhance customer engagement through Salesforce email automation and tracking.